The massive SolarWinds hack is a stark reminder of the importance of application security, but as most readers of this blog are aware, this event is unique only because of its size. The truth is that attacks on applications are rapidly growing in scale and frequency. Verizon’s latest Data Breach Investigations Report found that 43% of data breaches this past year were the result of a web application vulnerability—a figure that more than doubled over the previous year. Similarly, the Ponemon Institute and IBM recently found that 42% of companies that suffered a data breach attributed the cause to a known but unpatched software vulnerability.
THE PROBLEM OF SECURITY DEBT
Of course, attacks on applications are proliferating because cyber criminals like the success rate they realize when they use that vector. Part of the problem today is that applications have far too many vulnerabilities, even after they are released into production. Contrast Labs’ The State of DevSecOps Report found that almost every organization has an average of at least four unaddressed vulnerabilities per application in production. Given that startling metric, it is not surprising that 61% of those organizations experienced three or more successful application attacks over a 12-month period—and only 5% had none.
The breakneck speed at which applications are now developed means that the backlog of unfixed vulnerabilities at many organizations is steadily increasing. This “security debt” is a significant burden to development and security teams as they try to deliver secure software while meeting aggressive business deadlines. As it grows, security debt accrues a painful “interest” of sorts: Contrast Labs’ 2020 Application Security Observability Report found that organizations with below-average security debt saw an average of 68 new vulnerabilities per month, while those with above-average security debt had 183.
THE NEED FOR A BETTER RISK ANALYSIS TOOL
Getting on top of this burgeoning security debt requires an organizational commitment to prioritize application security, and it necessitates a prioritization strategy that results in the riskiest vulnerabilities being remediated first. Unfortunately, some organizations spend as much time doing risk rating and managing the backlog as they spend performing remediation. This is because a comprehensive tool to evaluate the risk of each vulnerability simply does not exist.
Current Resources Are Inadequate
As a result, development, operations, and security teams wind up using some combination of the incomplete tools that are available—and doing a lot of manual work to correlate the data and quantify the risk. Some of these tools include:
-
The OWASP Top 10 provides a starting point, but it does little to help in prioritizing specific vulnerabilities. And it is only updated once every several years.
-
The Common Weakness Scoring System (CWSS) is very accurate but too detailed, making it time-consuming to use with every single vulnerability identified. In addition, it only covers open-source vulnerabilities found in the Common Vulnerabilities and Exposures (CVE) database.
-
Factor Analysis of Information Risk (FAIR) is too detailed in its measurement of broader risk to use with specific vulnerabilities—too difficult to implement and manage.
The Likelihood of Attack Is Missing!
In addition to the weaknesses mentioned above, another problem with all these tools is that they do not take threat intelligence and modeling from application attacks—including probes—into account at all. This is a critical oversight, as vulnerabilities that are not exploited or probed by attackers pose significantly less risk than those that are targeted frequently. As a result, organizations could be remediating vulnerabilities that pose almost no risk while leaving high-risk threats for a later time.
Other factors that the existing models do not consider include what the business impact would be if a given application were compromised, and what compensating controls an organization has in place to mitigate vulnerability risk. Clearly, a more dynamic model is needed.
THE CONTRAST RISKSCORE INDEX: FILLING AN UNMET NEED
Seeking to develop a model that is comprehensive while being easy to use, Contrast Labs embarked on a search to create an algorithmic model that addressed both of these requirements, one that aggregated telemetry on both software vulnerabilities and application attacks. The risk-scoring model needed to dynamically adapt to real-world data, allow for uncertainty and missing data, and adaptively require additional data when the risk is near an organization’s risk threshold.
The Contrast RiskScore Index is still in beta, but careful readers of the bimonthly Contrast Labs Application Security Intelligence Reports know that early versions of the RiskScore Index have been included there since the July–August 2020 report. Contrast Labs just released V.5 Beta of its RiskScore Index Report, which provides more information about the algorithm and how different vulnerability types scored over the course of 2020. We also recently hosted a webinar in which several Contrast Labs team members discussed the index and the findings of the report.
The RiskScore Roadmap
Contrast Labs plans to release the Contrast RiskScore Index as an open-source project later this year. This will enable organizations to use data from their own applications, along with inputs about the unique risk profile of their business and their different applications, and generate a real-time score for the relative risk of different vulnerability types in their unique setting.
Until the open-source version is released, organizations can still benefit greatly from regular updates on the Contrast RiskScore Index in the bimonthly Application Security Intelligence Reports and in periodic RiskScore Index Reports. Understanding the fluctuation in risk posed by different vulnerability types can inform tactical tweaks in a long-term strategy to reduce security debt.
The RiskScore Algorithm
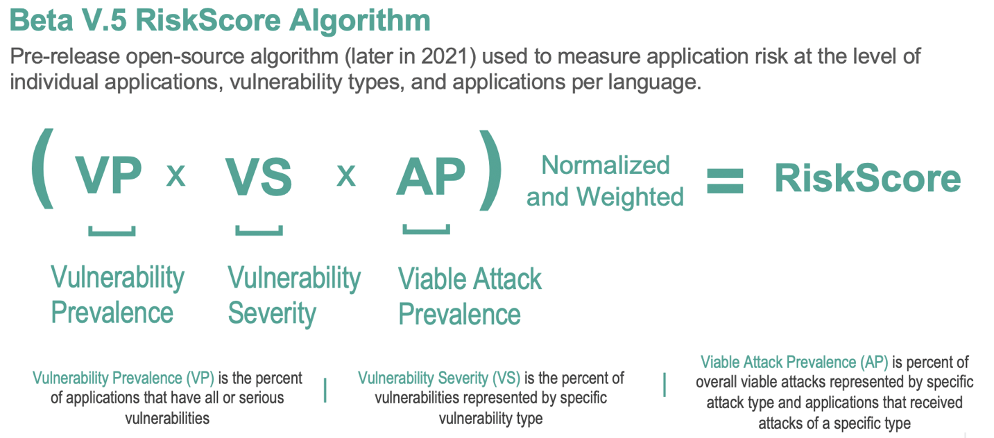
The Contrast RiskScore Index uses a relatively simple formula that multiplies vulnerability prevalence, vulnerability severity, and runtime attack likelihood, and then weights and normalizes the data into a 10-point scale. Inputs for factors such as programming language, importance of specific applications, and organizational risk profile will be added to the open-source version.
WHICH THREATS ARE MOST DANGEROUS?
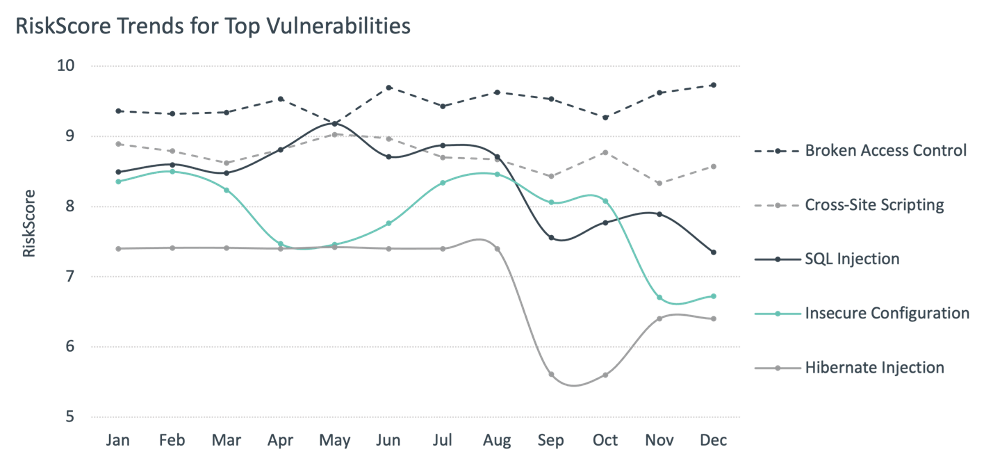
The RiskScore Index Report uses retroactive calculations of the current version of the RiskScore Index for each month of 2020 and provides analysis of the trends over that 12-month period. Overall, nine of 19 vulnerability types appeared in the top six RiskScores for at least one month during the year, and 14 appeared in the top 10.
The Perennial Top Three
For every month except two, the three most dangerous vulnerability types were the same: broken access control, cross-site scripting (XSS), and SQL injection. Broken access control topped the list for 11 months out of 12, and its RiskScore never dipped below 9.0. When attackers can gain unauthorized access to applications—and the databases to which they connect—this can pose grave organizational risk.
XSS and SQL injection fluctuated a bit more. The latter in particular seems to be trending downward in its raw RiskScore—and has the potential of moving out of the top three in 2021. While several well-publicized SQL injection attacks have occurred, some experts say that many SQL injection vulnerabilities pose less risk than is assumed.
Mid-tier Threats
While the top three vulnerability types in the RiskScore Index many not surprise many, a look at mid-tier threats is useful for informing periodic shifts in an organization’s vulnerability prioritization strategy. A total of five vulnerability types appeared in the top six RiskScore values—but not in the top three—in at least one month in 2020. Their fluctuation is interesting:
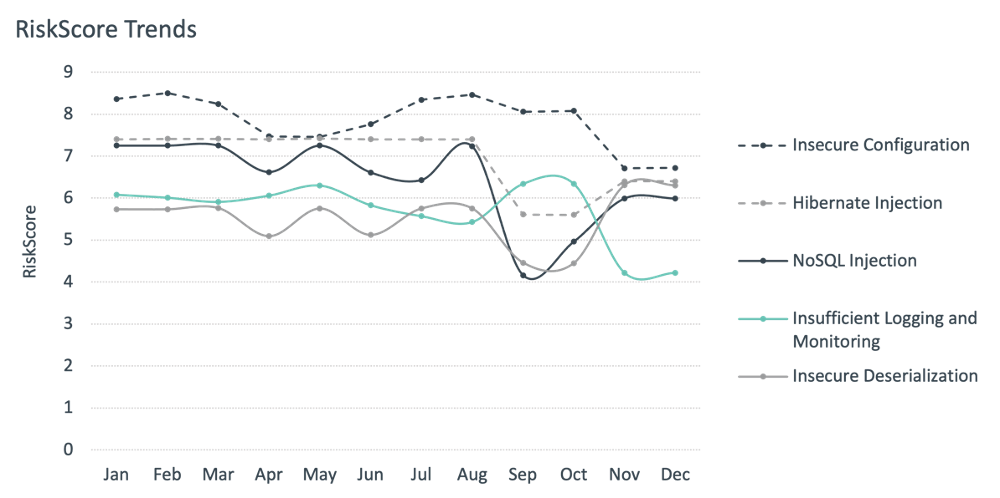
Two of the five, insecure deserialization and Hibernate injection, remained stable in the rankings (at #4 and #5 for almost the entire year) while fluctuating a bit in RiskScore. Other threats that moved into the #5 and #6 positions during the year include NoSQL injection, insecure deserialization, and insufficient logging and monitoring. A growth in the adoption of NoSQL databases has given rise to an increased focus on it. One application of NoSQL injection is to attack web applications built on the MEAN (MongoDB, Express, Angular, and Node) stack. As MEAN applications use JSON to pass data between databases and applications, injection of JSON code into a MEAN application can enable injection attacks against a MongoDB database.
USING THE RISKSCORE
For almost every person and organization, 2020 unfolded in ways that could not have been predicted at the beginning of the year. The result for most application development and security teams is even more pressure to churn out software quickly but securely. Not surprisingly, cyber criminals did not shut their operations down for the COVID-19 pandemic, and the Contrast RiskScore Index shows that the attacks they launched were remarkably steady throughout 2020.
Reducing security debt is a key component of an effective application security strategy. We hope that the RiskScore Index—in its initial beta form as well as subject open-source permutations—will be a useful resource to organizations in reducing security debt. Organizations need to be able to catch vulnerabilities as they occur—throughout the software development life cycle (SDLC). This reduces the time and cost required for remediation and diminishes the risk of vulnerabilities slipping into production.
Available Resources:
Report: RiskScore Index Report: Prioritizing Application Security Risk Management
Webinar: What To Include in a New Risk-Scoring Model for Applications—And How To Use It
Podcast: Building a Risk-Scoring Model for Applications: Initial Algorithm and the Underlying Data Elements


