Contrast Labs' analysis of real world application attack data from February 2018.
Overview
- In February, overall application attack volume more than doubled. Once again this month there were no applications or APIs that were not attacked.
- The majority of the attack traffic originated in the United States. This month saw continued dominance of injection attacks of all types (XSS, SQL, CMD, PATH, etc...) and added a significant rise in CSRF and Padding Oracle attacks. Attacks on CVEs slightly down in February.
- February brought much longer attacks, averaging 14.7 minutes. That's way up from just 3.45 minutes. The longest attack lasted just over 12 hours.
Observations: Attacks on Custom Code Vulnerabilities
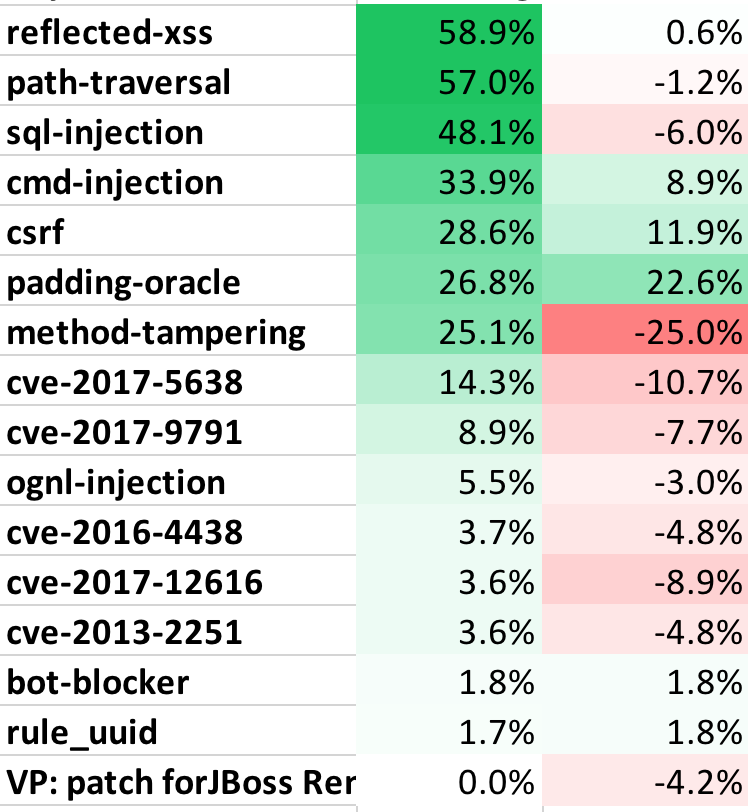
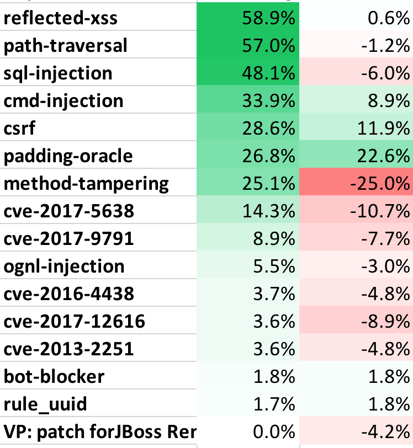
- Roughly half of applications were targeted with XSS, SQL Injection, and Path Traversal in February alone.
- Almost 27% of applications were hit with Padding Oracle attacks in February, up dramatically from January. Be careful with your error messages!
- We also observed a signfiicant rise in Cross-Site Request Forgery, which more than doubled to 28.6% of applications. Command Injection attacks also increased to over one-third of applications.
Observations: Attacks on Known Vulnerabilities (CVEs)
-
Attacks on CVEs were experienced by almost every application in February.
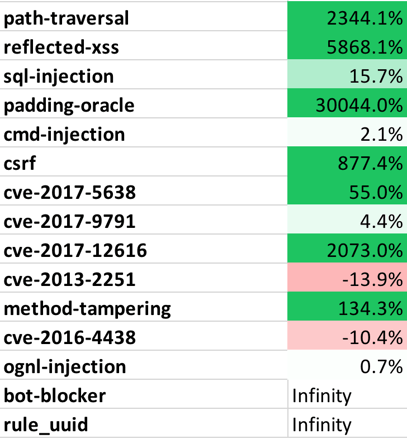
- Look out for CVE-2017-12616. We recorded a massive increase in attack traffic against this Tomcat VirtualDirContext vulnerability that allows security constraints to be bypassed.
-
While the percentage of applications targeted by CVE attacks decreased slightly from January, the attack volume on those targeted applications increased, significantly in some cases.
Observations: Attackers
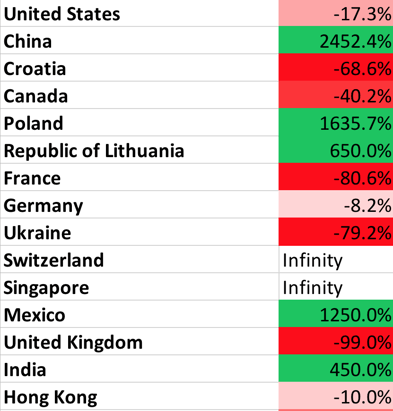
- February saw application layer attacks from 20 countries, 1245 cities, and 2372 different IP addresses. While attacks came from around the world, they overwhelmingly originated in the United States.
-
In February, there was a massive increase in attacks from China. Croatia, Canada, and Poland also originated attacks. As always, we caution that these numbers are distorted, as attackers may use remote hosts.
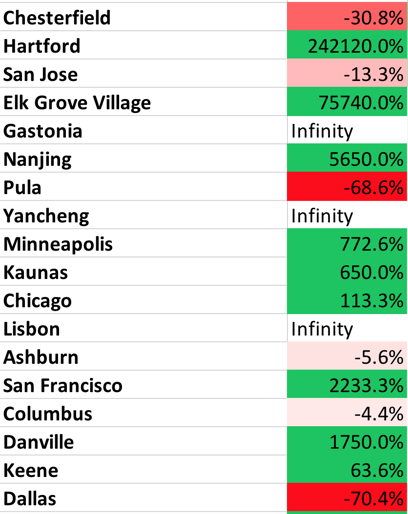
- Chesterfield is still our attack leader, with four months in the number one spot. Hartford also had a massive increase in attack traffic.
Top Attack Vectors
- The following table shows the percentage of applications that were attacked using each different attack vector. This may help you estimate the likelihood of one of your applications experiencing an attack in a month. Note that all applications were attacked during the month.
Table 1. Percentage of Applications Attacked (by Vector)
for February 2018 (%, Change)
- The following table lists the top attack vectors by volume of attacks, and the percentage change compared to last month. This is intended to give you an idea about both the most dangerous attacks as well as attack vectors that are becoming more or less dangerous.
Table 2. Attack Level Change (by Vector)
for February 2018 (Change in %)
Attack Geolocation
- The following table lists the top countries by attack volume and their change since last month. This may help you understand who might attack your applications, although be aware that many attacks are routed through other countries.
Table 3. Percentage of Attacks, by Country
for February 2018 (Change in %)
- The following table lists the top cities by attack volume and their change since last month. This may help you understand who might attack your applications, although many attacks are routed through other cites.
Table 4. Percentage of Attacks, by City
for February 2018 (Change in %)
