"How much memory do I need to add to my JVM to account for Contrast?"
Man, these questions sound really simple, don't they? I could probably just say "Add 128MB!" and everyone would probably be happy.
But that's not me. We need to science this thing.
Establish a Baseline
Our test scenario is this: Tomcat 6, Java 7 (HotSpot), five applications; one of which we'll be exercising. Here are some baseline numbers retrieved after startup, loading an app, and forcing GC.
Figure 1: Idle Memory Usage
| |
No Security Monitoring |
With Contrast |
| Heap (MB) |
24 - 67 |
45 - 80 |
| Non-Heap (MB) |
40 |
54 |
With Contrast on the heap started at 55MB, and idling slowly up for 5 minutes to 80MB before GC brought it back down to a 45MB baseline at which it hovered. The non-heap memory (PermGen + Code Cache) was constant at 54MB. This is expected; PermGen and code cache won't change unless new code gets loaded.
Without Contrast, the heap only grew to 67MB before it settled down at 24MB. The non-heap memory sat at 40MB, which tells you that Contrast and it's shaded dependencies account for about 14MB of bytecode (when uncompressed from a 4MB JAR).
So, just on baseline, Contrast requires about 25MB more heap space (extra data we're keeping around, seems like a lot, but I'll figure that out later) and 15MB more PermGen (the size of our code and dependencies in memory).
Load Testing the Agent
Contrast's memory requirements don't go up as the amount of loaded code goes up, but we do have to use some memory as we track "tainted" strings through their data flows. So, with that in mind, I thought I might want to analyze the memory use of an application as it is being spidered, comparing the results with and without Contrast. That would illustrate our runtime memory costs as opposed to the baseline cost.
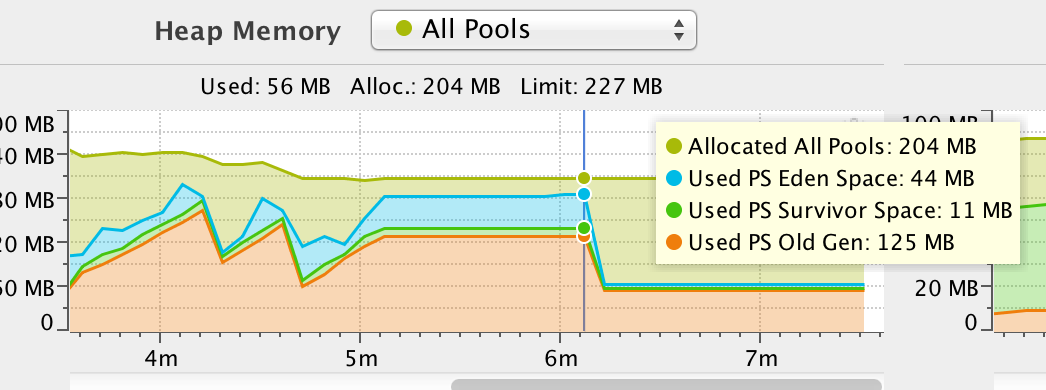
Same test scenario, with a crawler that executes a simple, high throughput crawl of the application 10,000 times. I primed the JIT, ran the test and got some interesting numbers.
Figure 2: Memory During High Utilization
| |
No Security Monitoring |
With Contrast |
| Peak Heap (MB) |
125 (67 from OldGen) |
204 (125 from OldGen) |
| Garbage Collections |
0 |
2 |
These are interesting for a few reasons. First, the obvious: discounting the baseline difference we discovered first (25MB) we see that a scanned app utilizes 55MB more heap space under security monitoring.
Second, we cause 2 garbage collection events. This sucks, but it also explains how more objects ended up in OldGen (61% as opposed to 53% of total heap space). This means under Contrast, perhaps quite obviously, more objects get created, and they last slightly longer. If they were less responsibly cleaned up, they could be dangerous: you would see OutOfMemoryExceptions everywhere as the cost of those long-living objects piled up faster than they could be handled. This is a great sign.

We could probably tune HotSpot's promotion of objects into OldGen to prevent our objects from reaching it, but that kind of tuning requires knowledge about how the app operates, and it'd be a bit irresponsible to give advice without know what other GC configurations you crazy kids are using these days.
So, Smartass, What's the Answer?
For many customers, we never get the question -- so that means their existing memory settings had enough padding to support Contrast, or they figured out the answer themselves. For those that do ask, I can offer you these conclusions.
For PermGen, the answer is easy: add 32MB. Even though we discovered we only needed 14MB, this gives us capacity to grow, and it's possible that edge cases will elicit more code to be loaded that we didn't exercise in our tests.
For heap, there are two answers: if memory is essentially free, you can just add 2x your current allocated space (controlled by the Xmx argument). So, if you're running with 512M, use 1G. If memory is not free, and we're watching what we eat, then the most accurate answer is a percentage. You should add 80% of your peak utilization, which is usually a lot less than 2x total allocated space). So, if at your maximum load, you're using 100MB, make sure your heap is at least 180MB -- and again, try to give yourself some capacity for growth.
This probably begs the question: how do you know your peak utilization? Ask your JVM when it's under load, using a profiler like VisualVM or JMX.
The Important of Measuring
Without measuring, you never know what your limits are, what problems are around the corner, and where costs are really occurring (hint: they're rarely exactly where you presume.) After doing this round of measurement, we discovered other things we could measure a lot more closely. We could query heap snapshots at peak utilization and figure out costly objects, and figure out ways to reduce their footprint. We could measure with different GC options and find out maximally performing strategies, now that we know what memory space our objects are in.
Measuring costs doesn't have to be annoying, either. I highly recommend YourKit, a Java profiler which is a joy to use. VisualVM is great, and free -- but it doesn't compare. Making Contrast almost invisible could happen one day, but for that to happen the JSR-163 guys would have to take my phone calls, emails, Twitter mentions or telepathic vibes. Until then, we'll keep measuring.


