X
August 15, 2019
July 2019 AppSec Intelligence Report: Attack Edition
What is this report: This report summarizes Contrast Labs' analysis of real world application attack data from July 2019. It utilizes data from attacks that Contrast observed over the previous months and highlights the key trends found.
Who should read this: Developers, product owners, AppSec, and security engineers can use the information to better understand application security threats, adjust their security controls accordingly, and improve their security posture.
Frequency: Through reading this report on a monthly cadence, AppSec teams can gain a better understanding of the possible types and origins of attacks and attackers that you might see.
To learn more about how Contrast directly measures both vulnerabilities and attacks in parallel across your application portfolio, please visit our website.
KEY OBSERVATIONS
SUMMARY
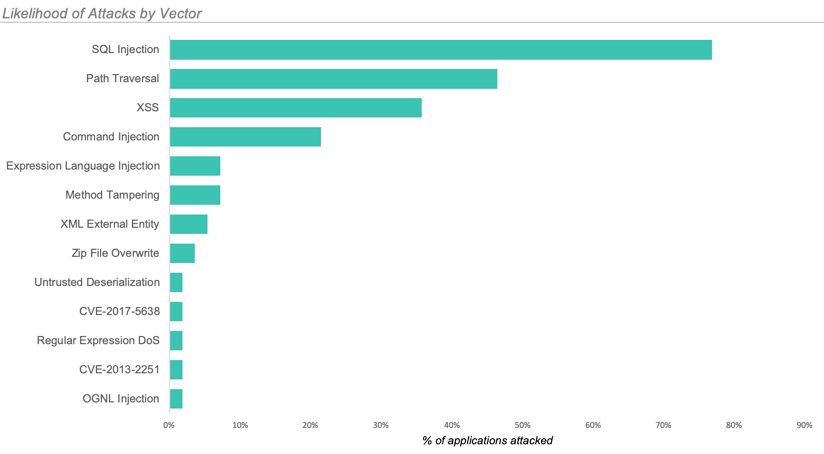

CUSTOM CODE ATTACKS
The three most common attack types in July:
In July, 96% of applications were targeted by one of these three types during the month.
TOP CVE ATTACKS
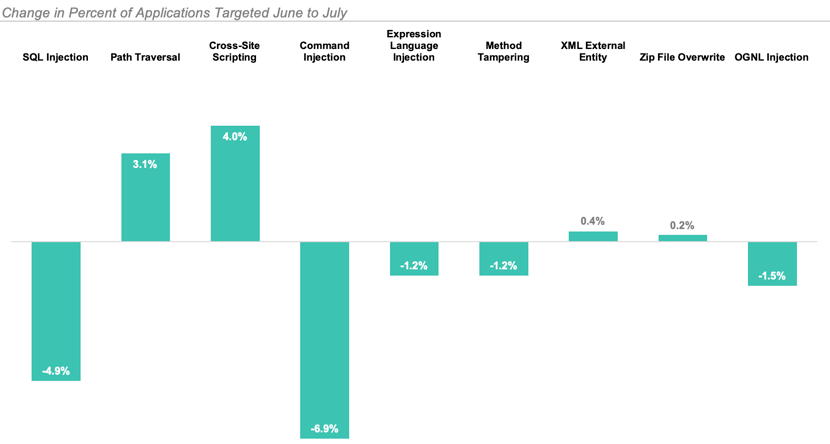
Exploiting vulnerable versions of Struts 2 continues to dominate attacks on CVEs.
CVE-2017-5638 (Struts 2 Input Validation) attacks remained the most prevalent attack on a CVE. However, its reign may be over. For the past 3 months, attacks on CVE-2017-5683 have represented an increasingly smaller portion of total attacks. We observed just over 50% of the attack volume in July that we had seen in June.
The next most common CVE targeted in July attacks was CVE-2013-2251. July marked the 6th anniversary of its first publish date and almost a year since an automatic exploit for the vulnerability was announced!
Attacks on CVE-2016-4438 (Struts 2 Input Validation), the second most common CVE targeted in June, dropped considerably in July.
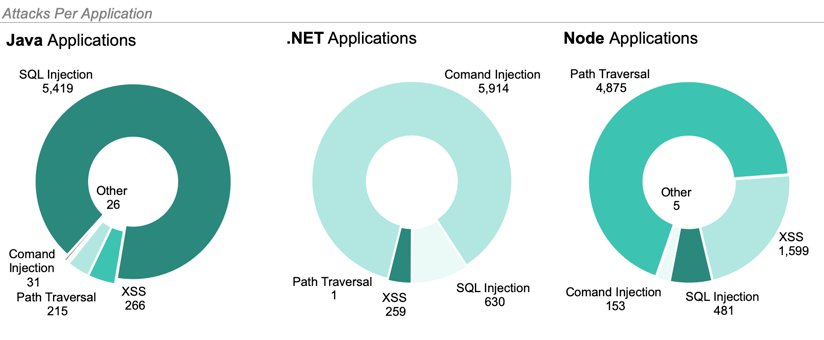
TOP ATTACK VECTORS BY LANGUAGE
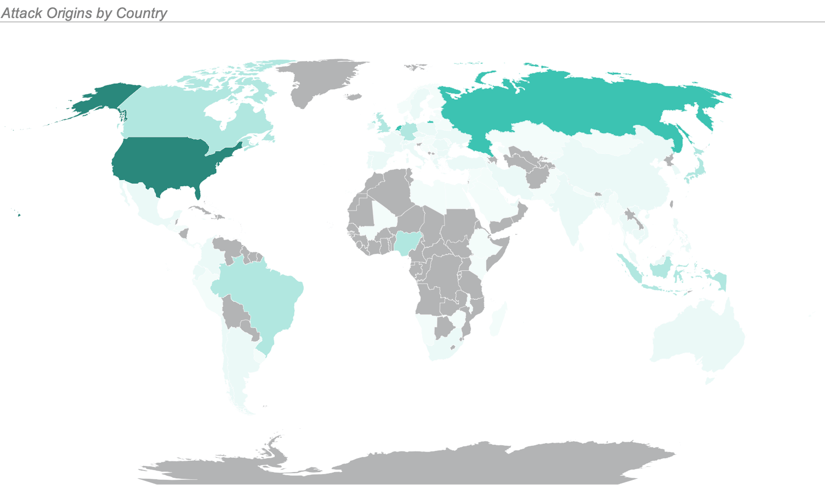
ATTACKS BY GEOLOCATION
July saw attacks from 6 continents and 109 countries.
The largest increase in volume May to June came from the Netherlands, where we observed a 2x increase in attacks. This higher volume remained relatively stable in July.
The map below illustrates the number of attacks originating from each country with the most saturated color representing the most attacks and the least saturated representing the least attacks. We observed no attacks from the countries filled in gray.