X
December 16, 2019
This report summarizes Contrast Labs' analysis of real world application attack and vulnerability data from November 2019. It builds on data that Contrast Security observed over the previous months and highlights to highlight key trends and useful tidbits we discovered. Developers, product owners, AppSec, and security engineers can use this information to better understand application security threats, adjust security controls, and improve their security posture. By reading this report on a monthly cadence, AppSec teams can gain a better understanding of the possible types and origins of attacks and attackers.
Visit our website to learn more about how Contrast Security continuously measures both vulnerabilities and attacks in parallel across your application portfolio.
The chart below shows the relative likelihood of vulnerabilities reported, as well as attacks by vector last month.
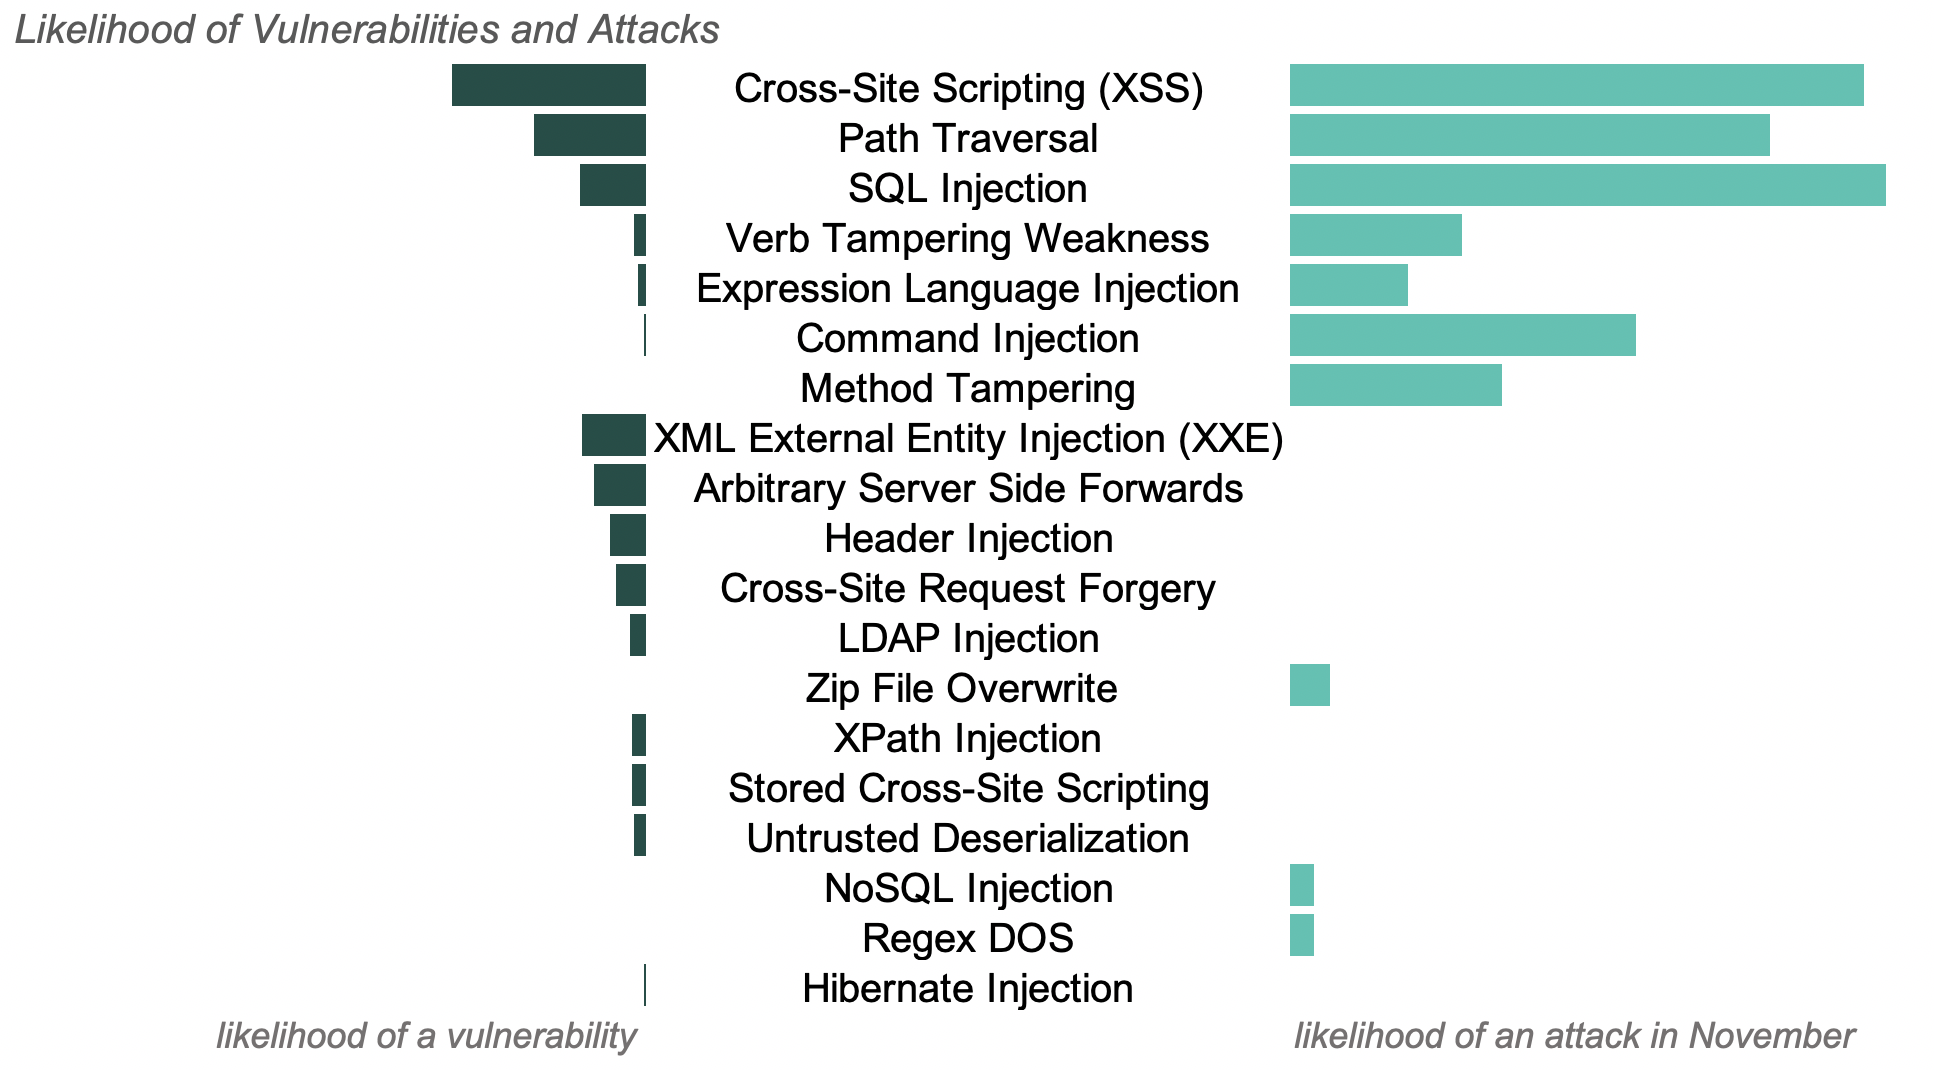
Contrast works by monitoring what the application does in response to normal usage and attacks.
In the chart above, there are vulnerabilities detected with no likelihood of attack. Attackers often launch payloads from scripted tools that look for vulnerabilities, then hone in manually on areas of interest. By watching the inside, Contrast determines when one type of attack, such as an XSS attack, reaches part of the application that uses another vulnerability, such as LDAP. In this case, attackers simply receive confirmation that their attack did not work. Contrast identifies that if another attacker comes along with a different payload (targeting the correct vulnerability class), that this second attacker could succeed and records the correct vulnerability class.
Contrast still reports, but de-prioritizes the attack as well. These unsuccessful attacks can be statistically common, but have little impact on the security posture for a specific application. In this report, Contrast Labs reports out all attacks and vulnerabilities recorded within real world applications so that security teams can learn what payloads attackers are using and understand the threat landscape at large.
A successful attack on a vulnerability can have wide-scale impact across many different organizations. It is critical for security teams to know about and properly manage library vulnerabilities, while also preparing for potential attacks.
Based upon the research included in this report, Contrast Labs short listed vulnerabilities that pose the highest risk to organizations. The list was created by combining the likelihood of a vulnerability and an attack (see previous chart) with the likelihood of a successful exploit and an impact factor. Below you can find this month's watch list.
Applications reported an average of 4 new, serious vulnerabilities in November. This number decreased from an average of 5 new, serious vulnerabilities in October.
The top 5 most prevalent serious vulnerabilities reported in custom code for the first time during November:
On average, Java and .NET applications reported the largest number of the following attacks:
Attacks on custom code made up over 99% of attacks last month.
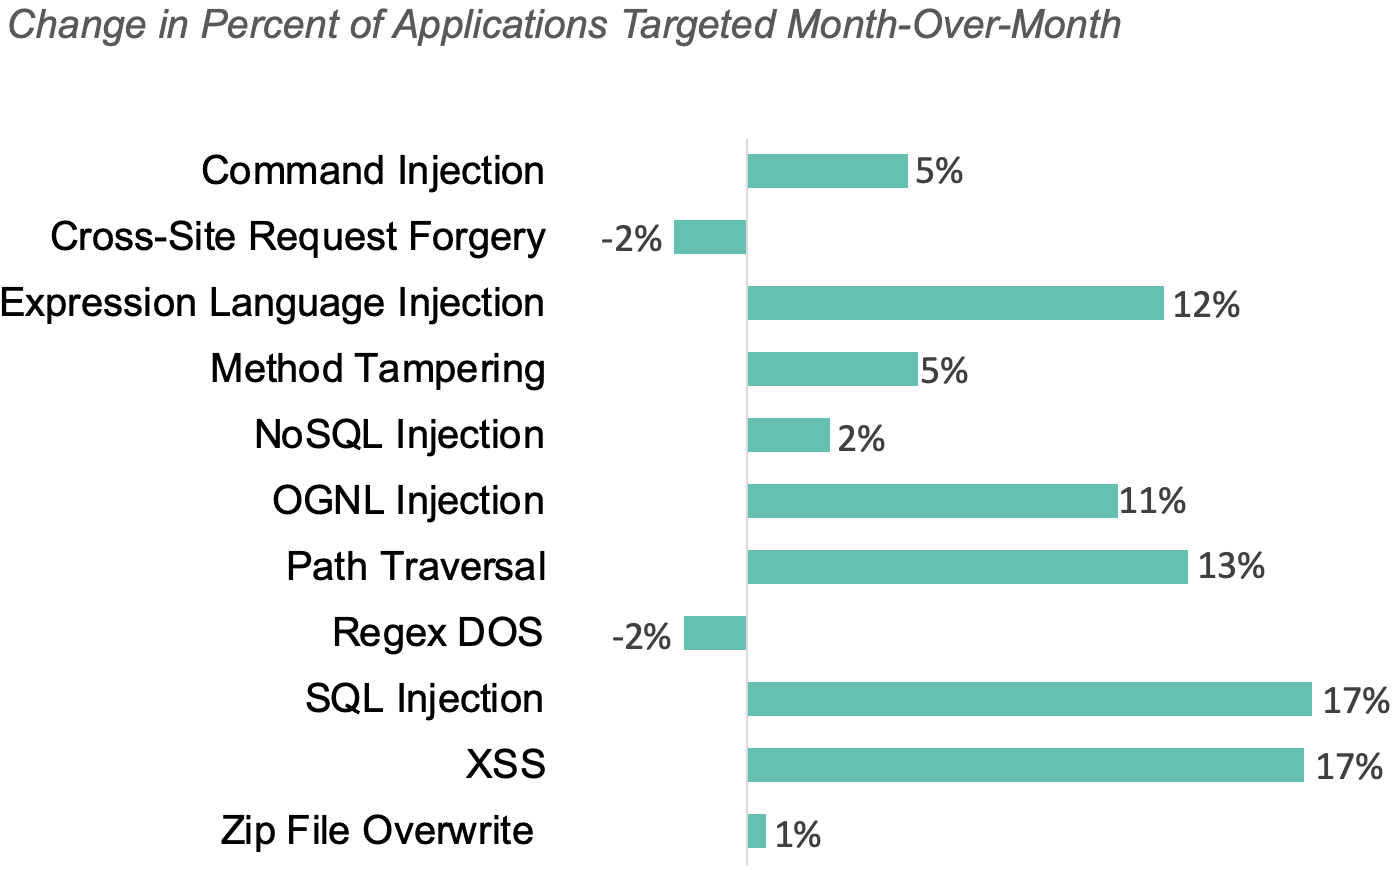
The three most common attack types in November were the same as October. We saw large increases in the number of applications targeted by all three types:
96% of applications were targeted by one of these three types during the month, up from 82% of applications in October.
The chart below shows how the percent of applications targeted changed for each attack type month-over-month.
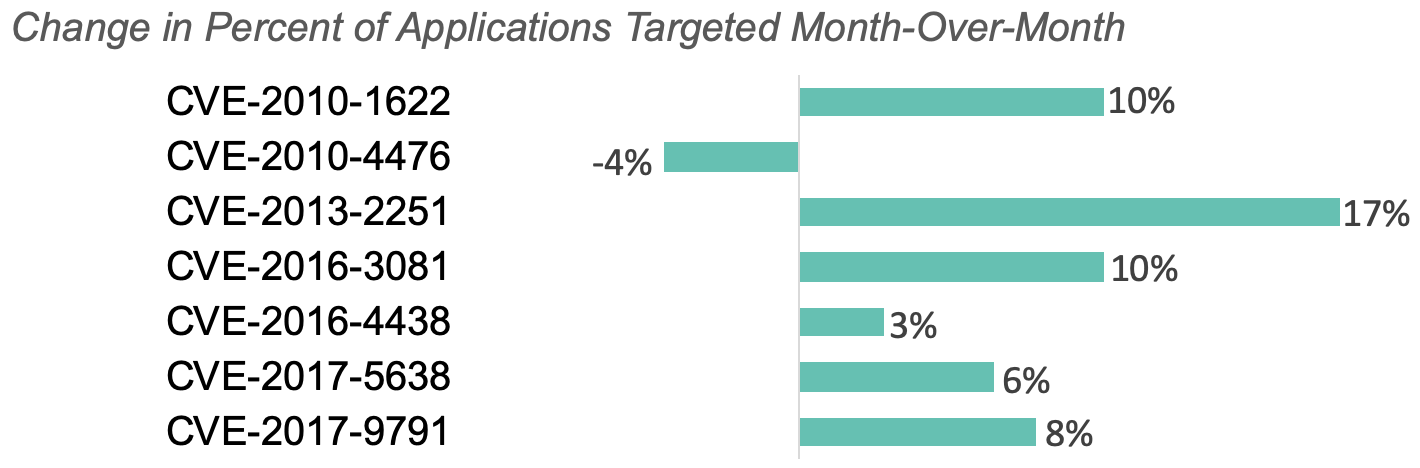
The top CVEs leveraged for attacks were CVE-2013-2251, CVE-2017-5638, and CVE-2017-9791.
Between October and November, we saw a spike (up 75%) in CVEs targeted. The chart below shows how the percent of applications with CVEs attacked changed month-over-month.
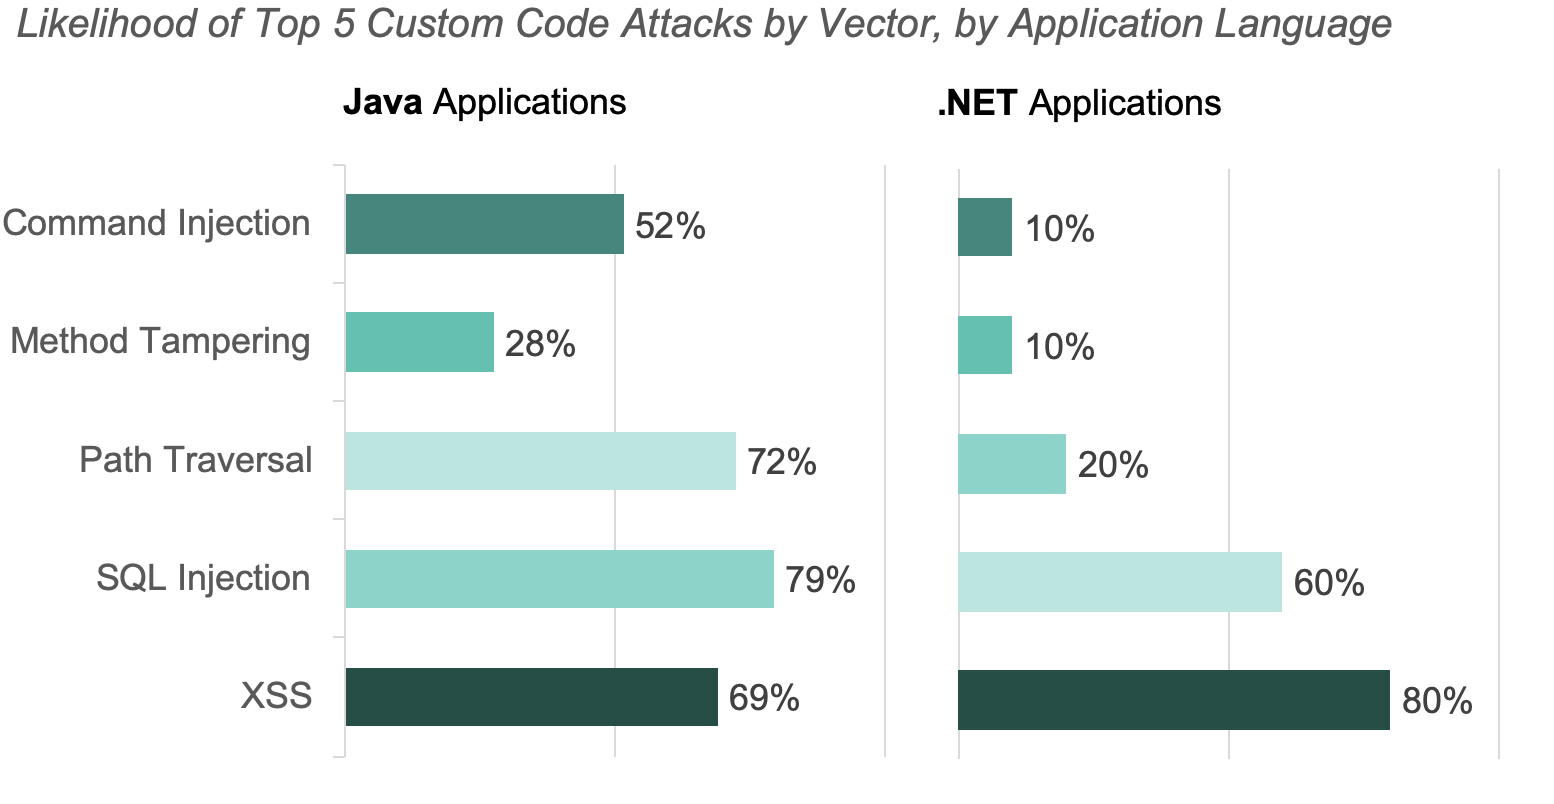
Attacks targeting injection vulnerabilities continued to be the most prevalent for Java applications in November. In October, Command Injection attacks were the most prevalent.
Attacks on XSS vulnerabilities were the most common on .Net applications. Both SQL Injection and XSS attacks were in the top three most prevalent attacks, regardless of application language.
The charts below show the percent of applications attacked, by vector last month for both Java and .Net applications.
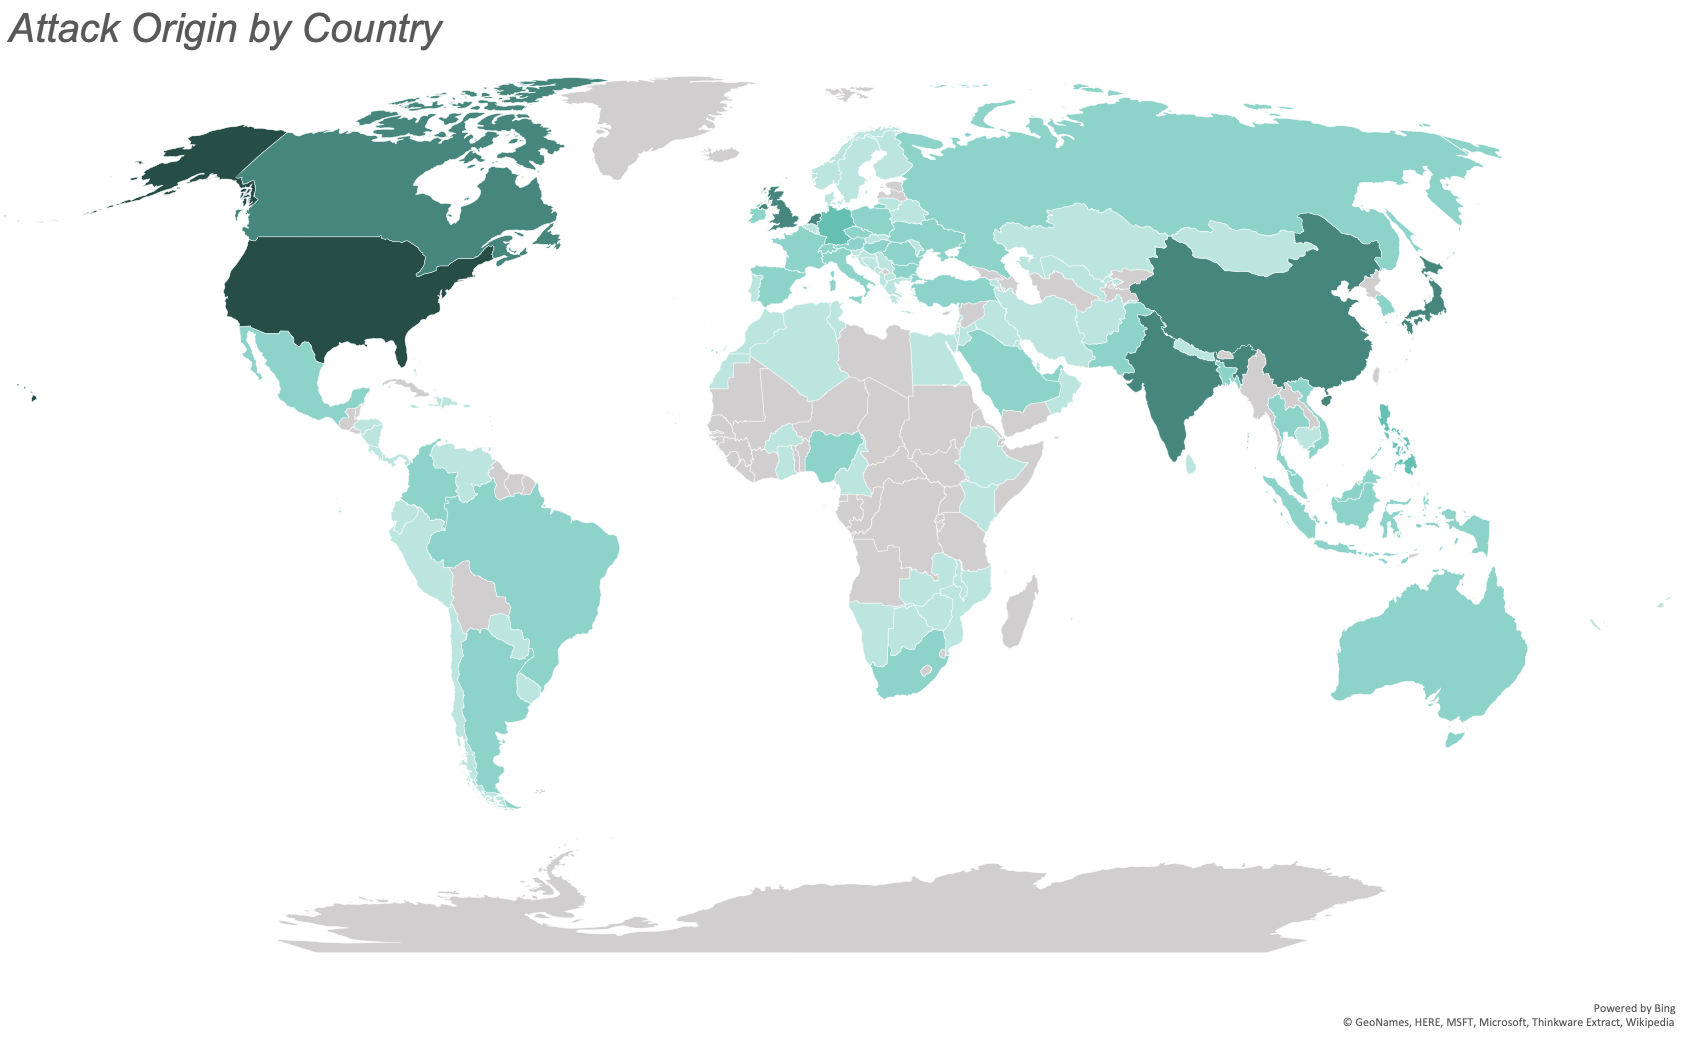
November saw attacks from 121 countries. The greatest number of attacks originated from the United States, India, Canada, the Netherlands, and China.
China moved up to the 5th most common origin country from tenth last month. We observed a 75% increase of attacks originating in China month-over-month.
The map below illustrates the number of attacks originating from each country with the most saturated color representing the most attacks and the least saturated representing the least attacks. We observed no attacks from the countries filled in gray.